What Limits Performance of (PyTorch) Neural Networks when running on a CPU?
This is a little experiment to use CPU performance monitoring counters to find out what limits the maximum performance of PyTorch Neural Networks when running on a CPU.
The experiment was carried out in the following way:
-
Performance metrics were calculated as described in the post describing counting PMU events in Python and the post applying this to PyTorch.
-
Measurements were made for all
torchvisionmodels, and repeated 10 times to obtain an average. The variety of models is used in order to have a range of algorithms so that the limiting factor becomes more apparent. -
Measurements were made in input data of dimensions 3x244x244
-
Measurements were made on a an Intel Xeon CPU E5-2630 v2 running at 2.60GHz
-
Measurements were run in single-thread mode:
torch.set_num_threads(1) -
In the plots below only every third model is labelled to avoid overcrowding the plot.
The following plot shows the FLOPS performance versus L1 cache miss rate for all of the models:
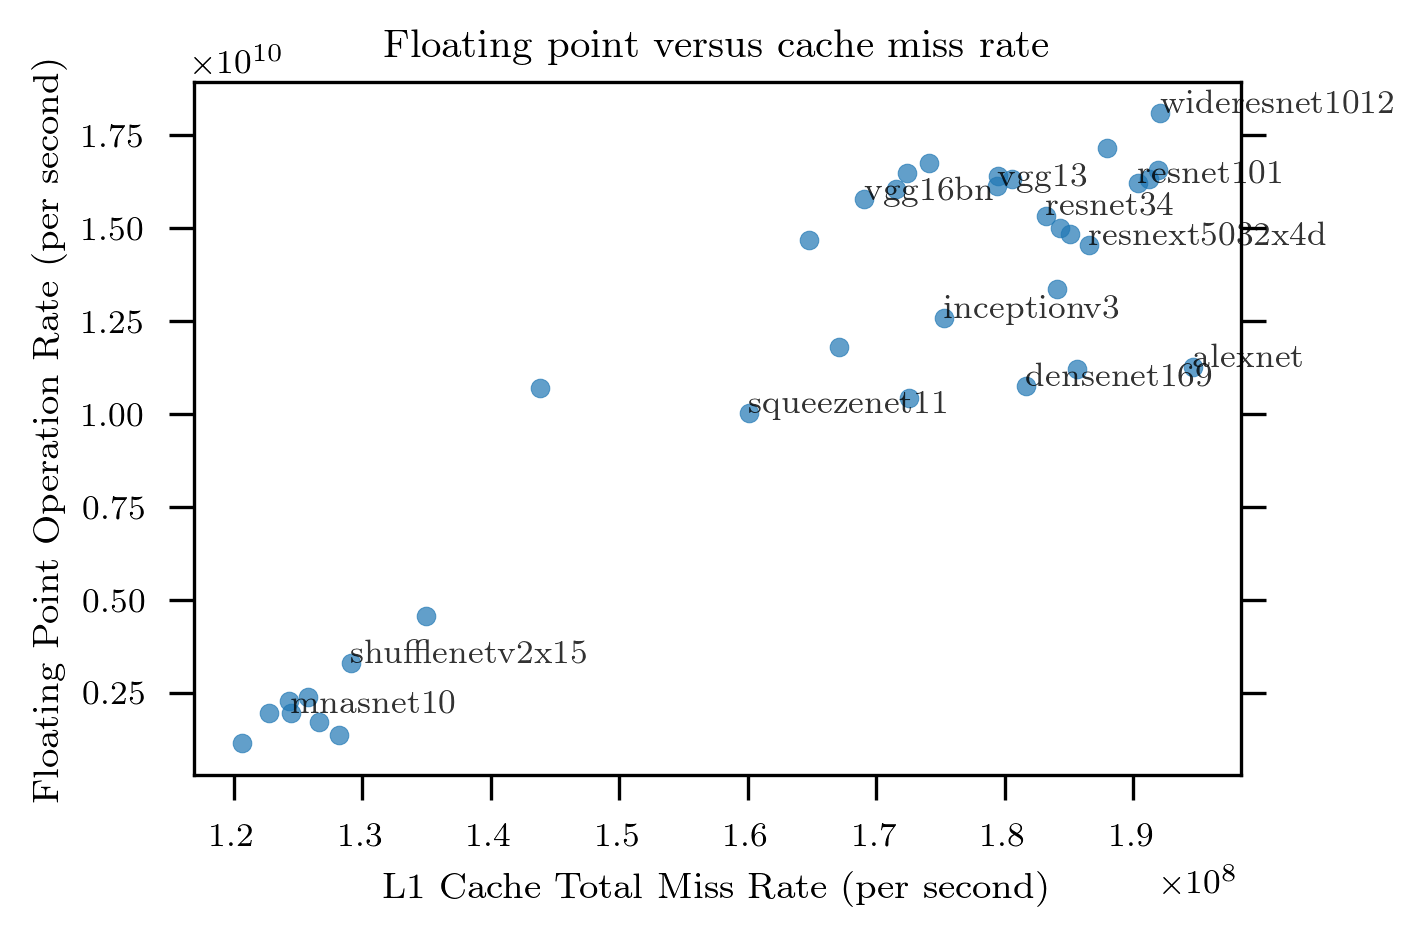
It can be seen that FLOPS rate is positively correlated with the miss rate showing that it very unlikely L1 cache misses limit performance.
The following plot shows FLOPS performance versus L3 cache misses:
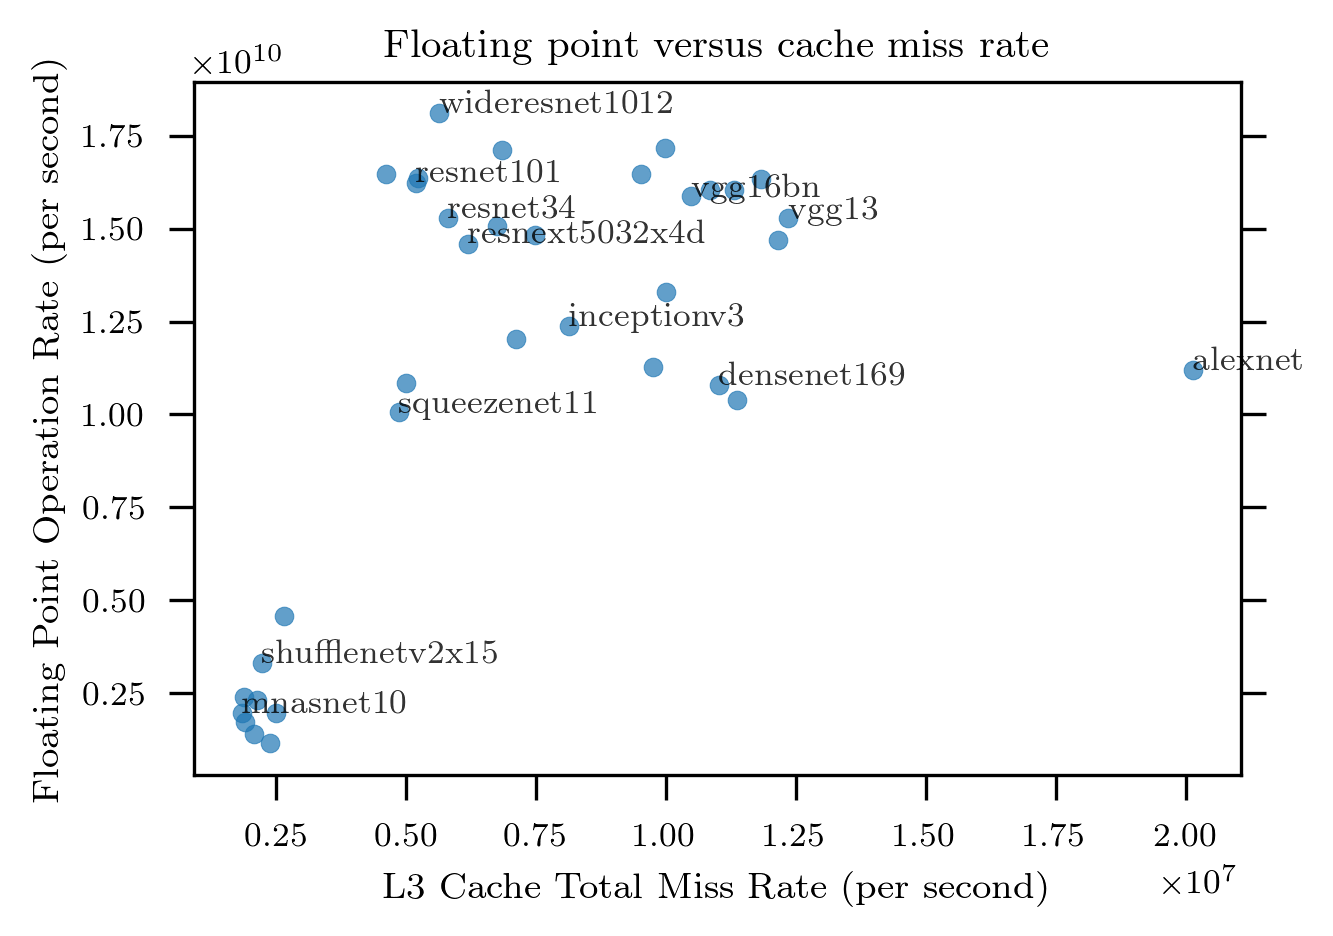
Over most of the plot the correlation is not strong, but where there appears to be some correlation it is again positive.
The following shows FLOPS rate versus branch instruction rate:
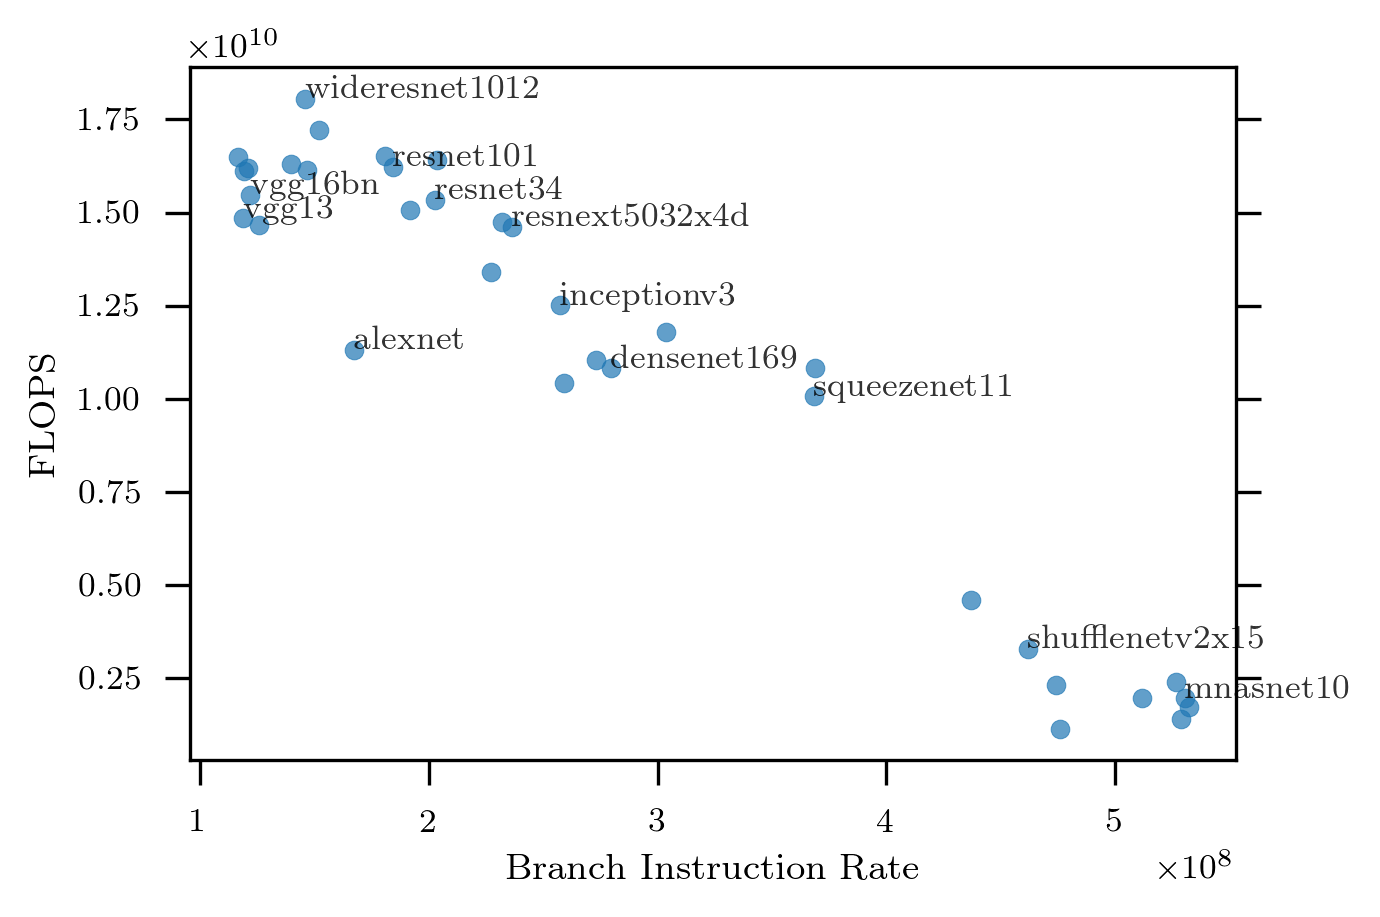
Here we can see evidence of a limiting factor: the FLOPS rate is negatively correlated with the branch instruction rate. In other words, models with (relatively) lots of branching are slower than models with few branches.
Summary
This quick experiment suggests that computational performance, on CPUs, of the neural network models considered here is limited by the branching logic in them rather than memory bandwidth or total floating point capacity.